Back الدين العام الأمريكي Arabic Замежная запазычанасьць ЗША BE-X-OLD Държавен дълг на САЩ Bulgarian Státní dluh Spojených států amerických Czech USA's statsgæld Danish Staatsverschuldung der Vereinigten Staaten German Deuda pública de Estados Unidos Spanish Ameerika Ühendriikide riigivõlg Estonian بدهی ملی ایالات متحده آمریکا Persian Dette publique des États-Unis French
This article needs to be updated. (March 2020) |

The federal government has a 6.75 to 1 debt to revenue ratio as of Q2 2023.

| This article is part of a series on the |
| Budget and debt in the United States of America |
|---|
  |

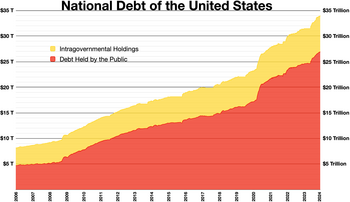
The national debt of the United States is the total national debt owed by the federal government of the United States to Treasury security holders. The national debt at any point in time is the face value of the then-outstanding Treasury securities that have been issued by the Treasury and other federal agencies. The terms "national deficit" and "national surplus" usually refer to the federal government budget balance from year to year, not the cumulative amount of debt. In a deficit year the national debt increases as the government needs to borrow funds to finance the deficit, while in a surplus year the debt decreases as more money is received than spent, enabling the government to reduce the debt by buying back some Treasury securities. In general, government debt increases as a result of government spending and decreases from tax or other receipts, both of which fluctuate during the course of a fiscal year.[1] There are two components of gross national debt:[2]
- "Debt held by the public" – such as Treasury securities held by investors outside the federal government, including those held by individuals, corporations, the Federal Reserve, and foreign, state and local governments.
- "Debt held by government accounts" or "intragovernmental debt" – is non-marketable Treasury securities held in accounts of programs administered by the federal government, such as the Social Security Trust Fund. Debt held by government accounts represents the cumulative surpluses, including interest earnings, of various government programs that have been invested in Treasury securities.

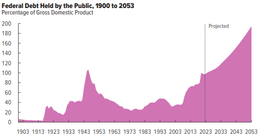
Historically, the U.S. public debt as a share of gross domestic product (GDP) increases during wars and recessions and then subsequently declines. The ratio of debt to GDP may decrease as a result of a government surplus or via growth of GDP and inflation. The Congressional Budget Office (CBO) estimated in February 2024 that Federal debt held by the public is projected to rise from 99 percent of GDP in 2024 to 116 percent in 2034, and would continue to grow if current laws generally remained unchanged. Over that period, the growth of interest costs and mandatory spending outpaces the growth of revenues and the economy, driving up debt. Those factors persist beyond 2034, pushing federal debt higher still, to 172 percent of GDP in 2054.[3] In recent decades, aging demographics and rising healthcare costs have led to concern about the long-term sustainability of the federal government's fiscal policies.[4] The aggregate, gross amount that Treasury can borrow is limited by the United States debt ceiling.[5]
Total US federal government debt breached $30 trillion mark for the first time in history in February 2022.[6] As of December 2023, total federal debt was $33.1 trillion; $26.5 trillion held by the public and $12.1 trillion in intragovernmental debt.[7] In February 2024, the total federal government debt grew to $34.4 trillion after having grown by approximately $1 trillion in both of two separate 100-day periods since the previous June.[8] The annualized cost of servicing this debt was $726 billion in July 2023, which accounted for 14% of the total federal spending.[9] In December 2021, debt held by the public was estimated at 96.19% of GDP, and approximately 33% of this public debt was owned by foreigners (government and private).[10] The United States has the largest external debt in the world. The total number of U.S. Treasury securities held by foreign entities in December 2021 was $7.7 trillion, up from $7.1 trillion in December 2020.[11]
During the COVID-19 pandemic, the federal government spent trillions in virus aid and economic relief. The Congressional Budget Office (CBO) estimated that the budget deficit for fiscal year 2020 would increase to $3.3 trillion or 16% GDP, more than triple that of 2019 and the largest as % GDP since 1945.[12]


- ^ "Historical Tables – Table 1.2 – Summary of Receipts, Outlays, and Surpluses or Deficits (-) as Percentages of GDP: 1930–2017" (PDF). Office of Management and Budget. Retrieved April 16, 2012.
- ^ "Federal debt basics – How large is the federal debt?". Government Accountability Office. Archived from the original on July 6, 2011. Retrieved April 28, 2012.
- ^ "The Budget and Economic Outlook: 2024 to 2034". CBO. February 7, 2024. Retrieved February 7, 2024.
- ^ "The 2022 Long-Term Budget Outlook". Congressional Budget Office. July 27, 2022. Retrieved September 30, 2022.
- ^ About 0.8% of debt ($1009 billion) is not covered by the ceiling, per The Debt Limit: History and Recent Increases, p. 4. (Note: This includes pre-1917 debt), fpc.state.gov; accessed August 22, 2016.
- ^ Rappeport, Alan (February 1, 2022). "U.S. National Debt Tops $30 Trillion as Borrowing Surged Amid Pandemic". The New York Times. ISSN 0362-4331. Retrieved February 2, 2022.
- ^ "Debt to the Penny". fiscaldata.treasury.gov. United States Department of the Treasury. Retrieved December 4, 2023.
- ^ Fox, Michelle (March 1, 2024). "The U.S. national debt is rising by $1 trillion about every 100 days". CNBC. Retrieved March 1, 2024.
- ^ "What is the national debt?". fiscaldata.treasury.gov. United States Department of the Treasury. Retrieved August 18, 2023.
- ^ "Foreign Holdings of Federal Debt" (PDF). Congressional Research Service. Retrieved August 29, 2022 – via Federation of American Scientists.
- ^ "Foreign Holdings of Federal Debt" (PDF). Congressional Budget Office. May 25, 2022. Retrieved September 29, 2022.
- ^ "An update to the budget outlook 2020 to 2030". September 2, 2020. Retrieved September 6, 2020.